Introduction
In this article we give a complete overview of the function
myrror(). We will go through the main steps of the
comparison, and show how to use the auxiliary functions to extract
differences between two data frames. In the first example, we will look
at the case where both datasets are identified: this
means that the user has supplied a set of keys to align the rows of the
two data frames. In the second example, we will look at the case where
the datasets are not identified: this means that the
user-supplied keys do not uniquely identify the rows of the two data
frames.
Identified Data
For the first comparison, we will use the survey_data
and survey_data_all datasets. survey_data_all
is a variation of survey_data which contains all possible
issues that can arise during the comparison: differences in values, a
variable with a change in class, a different number of columns, and a
different number of rows. Additionally, the two datasets have different
keys names, which can be supplied to the function like so:
myrror(survey_data, survey_data_all, by = c('country' = "COUNTRY", "year" = "YEAR"),
       interactive = TRUE)
When running the function in interactive mode, the user will fo through this screen:
General Overview
The first part of a myrror() report shows the general
characteristics of the two dataframes, including the number of rows and
columns, the keys used for the comparison (by argument) ,
whether there are missing rows or columns, and if so, their number and
name:
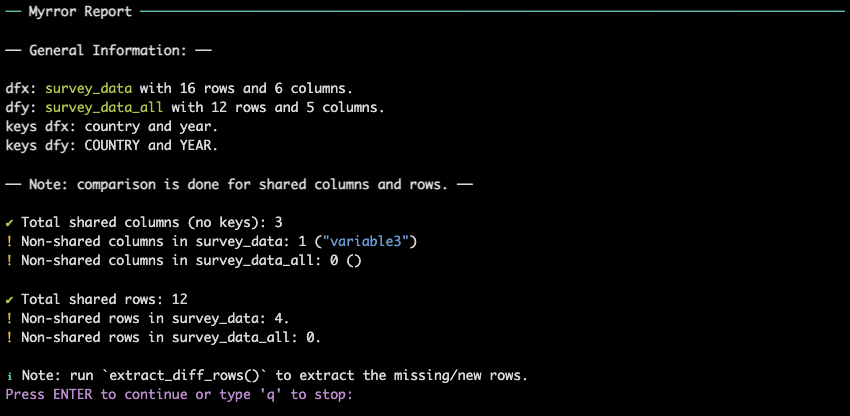 At the end of the
general overview, a ℹ️ Note suggests to the user to run
At the end of the
general overview, a ℹ️ Note suggests to the user to run
extract_diff_rows() to see the differences in the number of
rows. More on this function in the article Extract Different Rows.
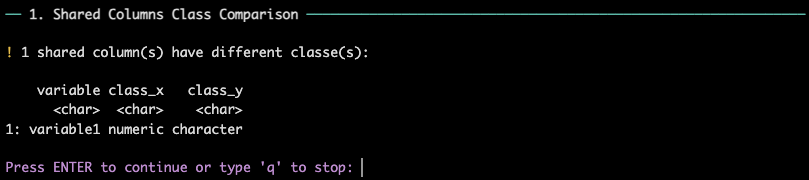
Compare Values
Next, the report shows the differences in values between the two data
frames. The user can see a summary of how many values are different for
each variable, and which type of difference is present (change in value,
value to NA, or NA to value): 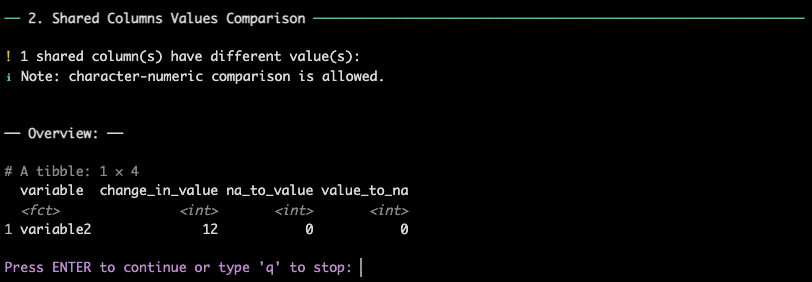
Extract Differences
Finally, user can have a better look at the differences variable by
variable: 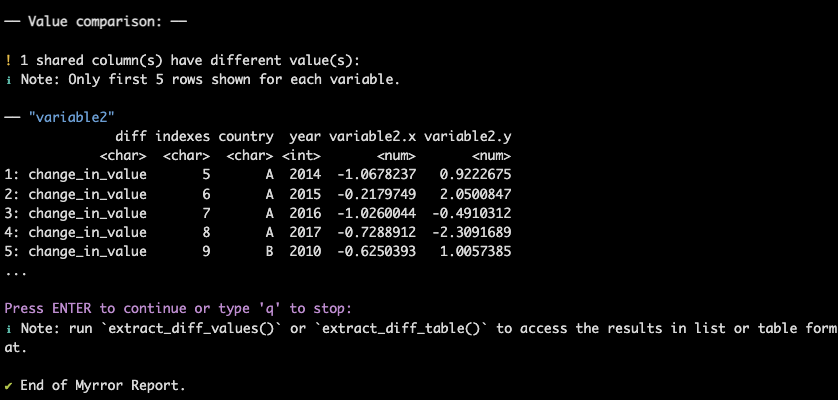 As
suggested by the ℹ️ Note, the user can run
As
suggested by the ℹ️ Note, the user can run
extract_diff_values()/extract_diff_table to
see the differences in list or table format. More on these functions in
the articles Extract Different
Values.
Non-Identified Data
For the second comparison, we will use the survey_data
and survey_data_1m datasets. survey_data_1m is
a variation of survey_data in which the keys
country and year do not uniquely identify the
rows of the two data frames.
The user will be warned about this issue and asked whether to proceed with the comparison:
Warning 1: not identified.
If one of the two data frames is not identified, the user will be warned about this issue:
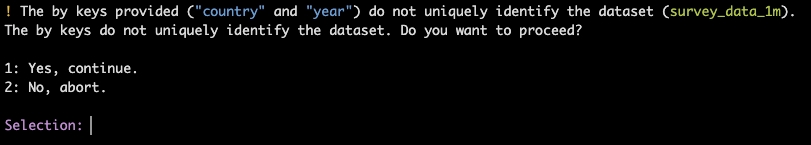 The warning will be
repeated if both data frames are not identified.
The warning will be
repeated if both data frames are not identified.
Warning 2: 1:m match.
If the user decides to proceed with the comparison,
myrror() goes through the second check. If the match
between dfx and dfy is not
1:1 (either 1:m or m:1), the user will be warned about this
issue:
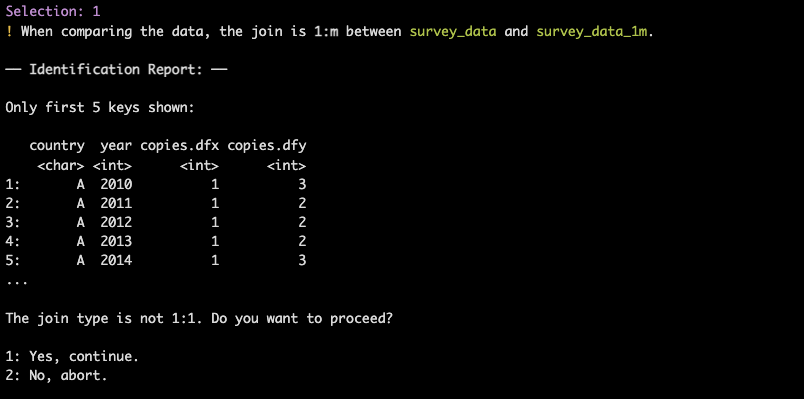
Note that if the match is m:m, comparison will be
aborted by default. After this series of warnings, the comparison
proceeds as before. Again, we want to re-iterate that in the case of
non-identified datasets, the comparison is done by row number
(rn). This means that row alignment is based on
position within the dataset, not on the content of the row, which
might result in myrror() reporting more discrepancies than
if the rows were aligned based on row content. This is also why we
always suggest the user to provide keys, if possible.